Written by Aurélien Callens, PhD. Data Scientist at Sustaain
Coffee Suitability Maps: Mapping Where Coffee Can Thrive in Uganda
Finding coffee plots from satellite imagery requires knowing where coffee can exist in the first place. Suitability mapping provides fast, actionable spatial constraints grounded in agronomic knowledge.
What is Suitability Mapping and Why It Matters
Coffee is a plant, and like any plant it grows only within specific ecophysiological limits: temperature, rainfall, soil chemistry, terrain, and land use all define whether coffee can survive, let alone be productive.
Decades of agronomic research have focused on identifying these optimal growing conditions for soft commodities. This knowledge underpins critical decisions: where to grow crops, what yields can be expected, and how production zones may shift under climate change (DaMatta et al., 2018; Pham et al., 2019; Kath et al., 2020).
For coffee, suitability is driven by four main groups of factors:
- Climatological factors such as temperature and rainfall
- Edaphological factors related to soil properties
- Physiographic factors such as elevation and slope
- Socioeconomic factors including land use and legal constraints
Scientific literature provides concrete thresholds for many of these variables. For example, studies such as Salas et al. (2020) and Nigussie et al. (2024) define clear suitability ranges for Arabica coffee across climate, soil, terrain, and land-use dimensions :
Sub-criteria suitability threhsolds (requirements) for Arabica growing from Salas et al. (2020) and Nigussie et al. (2024)
| Variable | Optimal | Sub-optimal | Not suitable |
|---|---|---|---|
| Climatological factors | |||
| Mean annual rainfall (mm) | 1200–1800 | 1000–1200, 1800–2000 | 0–1000, 2000–∞ |
| Mean annual temperature (°C) | 18–23 | 15–18, 23–26 | 0–15, 26–∞ |
| Edaphological factors | |||
| pH | 5-6.5 | 4.5-5; 6.5-7.5 | < 4.5; >7.5 |
| CEC | > 250 | 150-250 | > 150 |
| Physiographic factors | |||
| Elevation | 1400–1800 | 1800–3000 | < 1400, 3000–∞ |
| Slope | 0–15 | 15–30 | 30–∞ |
| Socioeconomic | |||
| Land Use | Cropland | Shrubland, Grassland | Tree cover, Other |
| Protected Natural Areas (PNA) | Out | Within |
Suitability mapping consists of combining all these constraints into a single spatial representation. This is inherently multi-factorial and non-trivial. Each variable may be suitable in isolation, yet unsuitable once combined with others. Elevation may be ideal, but temperature too high. Rainfall may be optimal, but land use prohibitive…
Traditional approaches address this complexity through expert-based weighting systems (Salas et al., 2020; Nigussie et al., 2024). While powerful, these methods are slow to implement, difficult to reproduce, and sensitive to expert choice and regional context. Different experts often assign different importance to the same factors, leading to inconsistent results.
Suitability mapping therefore sits at the intersection of agronomy, data integration, and decision-making. Done well, it converts fragmented environmental knowledge into a coherent spatial filter that supports planning, investment, and downstream analytics such as remote sensing and machine-learning models.
Our Approach
The objective was to produce suitability maps for both Arabica and Robusta coffee across Uganda, using a method that is fast to deploy, transparent in its assumptions, and technically defensible.
Our methodology :
- The starting point is the scientific literature. For each coffee species, suitability thresholds are extracted for key variables, defining optimal, sub-optimal, and unsuitable conditions (see the table above for Arabica coffee).
- We then assemble a set of open, global datasets covering the main drivers of coffee suitability. Climatic variables, elevation, soil properties, land cover, and protected areas are collected from established reference sources and harmonized onto a common spatial grid covering Uganda at 100 m resolution. Coarser datasets are interpolated to this grid to enable pixel-level comparison across all variables.
| Variables | Spatial resolution | Source |
|---|---|---|
| Rainfall estimates | 5km | CHIRPS |
| Mean annual temperature | 9km | ERA5 |
| Elevation (slope is computed from elevation) | 30m | Copernicus DEM (COP-DEM-GLO-30) |
| Edaphological data (pH and CEC) | 250m | Soilgrids |
| Land cover | 10m | ESA WorldCover |
| Protected Natural Areas | / | WDPA |
- Each variable is assigned a suitability score based on literature thresholds.
- Continuous variables such as rainfall, temperature, elevation, pH, and CEC are classified into discrete suitability classes.
- Categorical variables such as land cover are mapped directly to suitability scores or exclusion masks. Protected areas and water bodies are treated as hard constraints and fully excluded from suitability.
- Suitability scores are combined through simple addition across factors. No expert-based weighting is applied.
- Elevation is enforced as a hard threshold due to its dominant role in defining coffee agro-ecological zones in Uganda (UCDA, 2019). This choice prioritizes interpretability and reproducibility over fine-tuned optimization.
- The resulting composite scores are reclassified into three final categories: not suitable, sub-optimal, and optimal. The full workflow is applied independently to Arabica and Robusta to reflect their distinct ecological requirements.
This approach deliberately favors clarity over complexity. Every assumption is explicit, every transformation traceable, and every output directly linked to agronomic knowledge and open data.
What We Found
Single factor suitability maps
Each factor produces a distinct spatial signal.
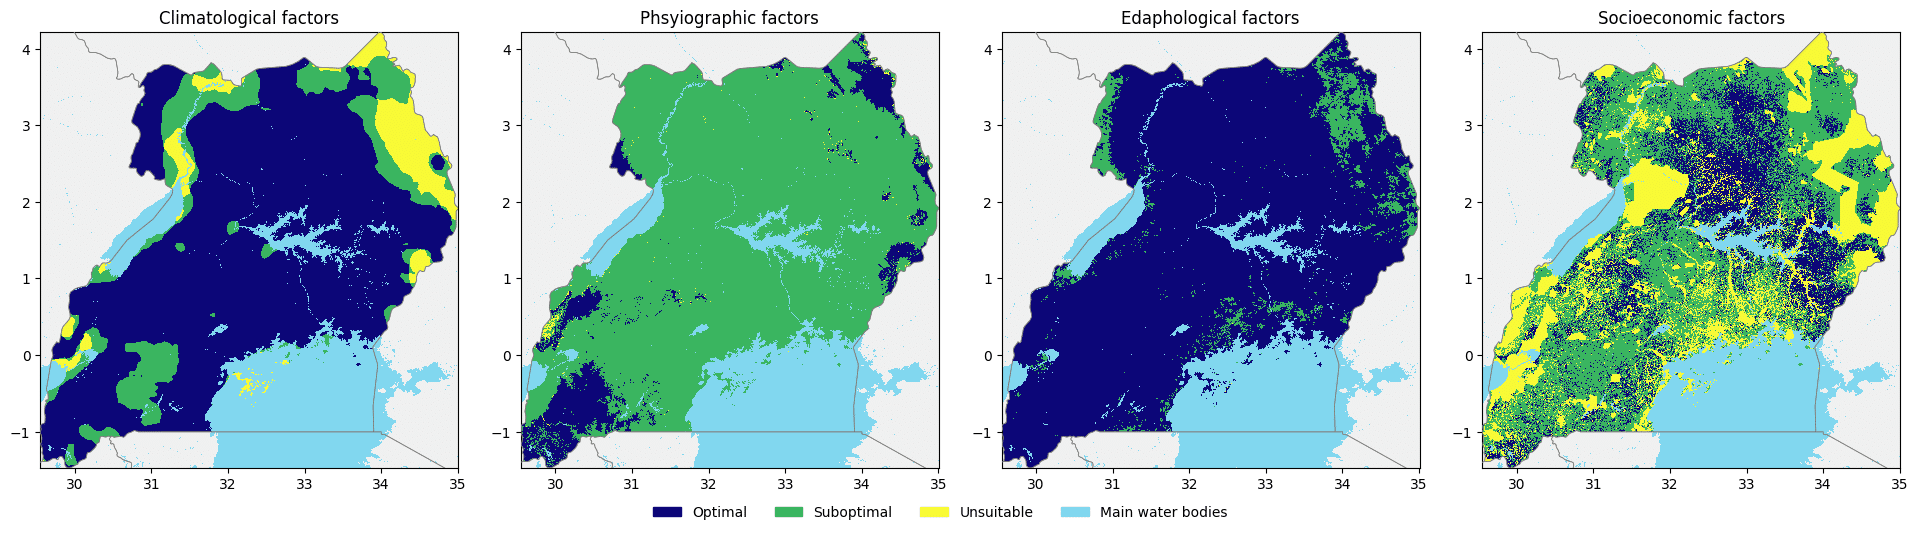
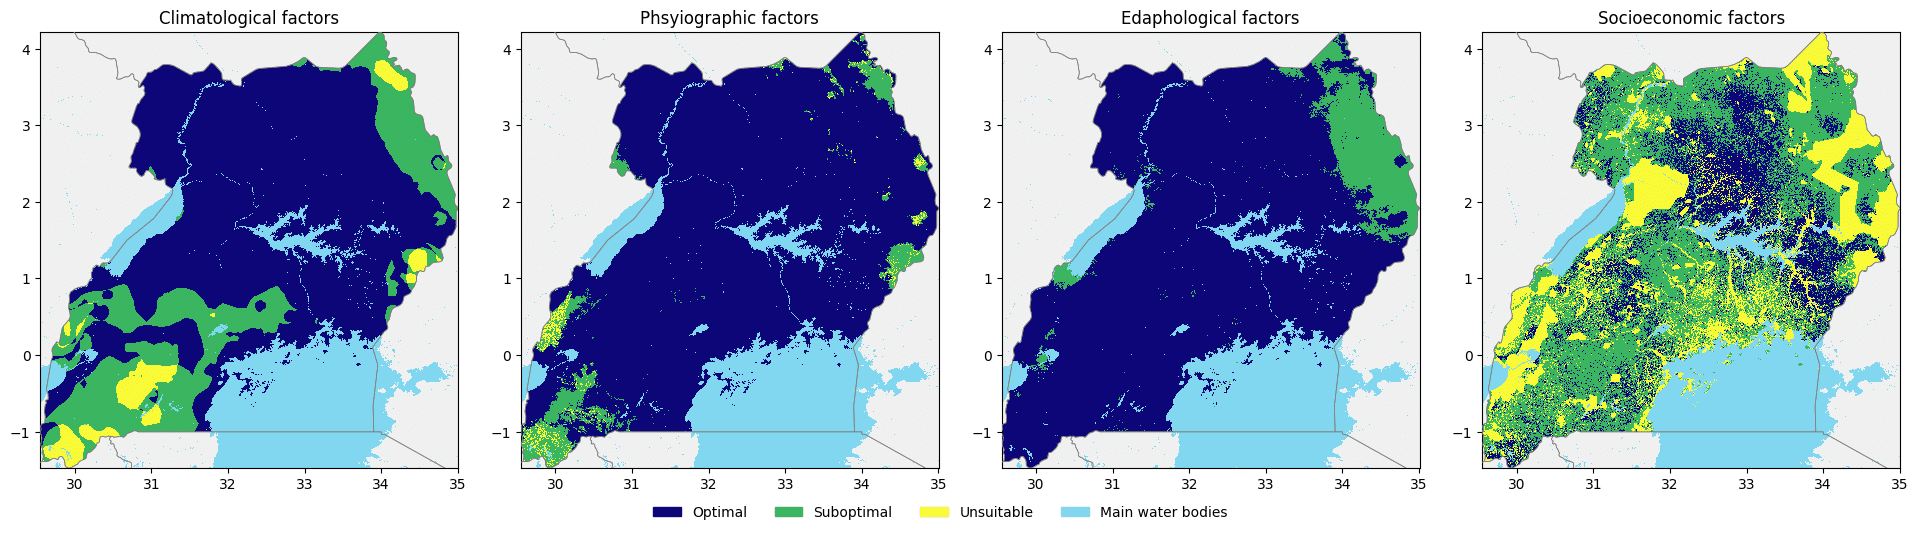
- Climatological suitability highlights broad regional patterns driven by temperature and rainfall gradients. Large areas of Uganda fall within acceptable climatic ranges, but marginal and unsuitable zones emerge at the extremes, particularly in hotter lowlands or cooler high-altitude regions.
- Physiographic suitability, dominated by elevation and slope, acts as a strong spatial constraint. Elevation sharply differentiates Arabica and Robusta zones, confirming its role as a primary limiting factor.
- Edaphological suitability is more spatially homogeneous at national scale. Soil constraints eliminate fewer areas than climate or elevation, but they refine suitability locally, especially at the margins of otherwise favorable regions.
- Socioeconomic factors introduce fragmentation. Land use and protected areas break otherwise continuous suitable zones into patchy landscapes, reflecting real-world constraints on cultivation rather than biological limits.
Taken individually, no single factor explains suitability. Their value lies in combination.
Composite suitability maps
Once factors are combined, coherent agro-ecological patterns emerge.

Robusta suitability dominates warm, humid, lowland regions, forming large contiguous areas aligned with known production basins. Arabica suitability is far more restricted, concentrated in cooler, higher-elevation zones, primarily along mountainous and highland regions.
Sub-optimal zones appear as transition belts where one or more variables fall outside optimal ranges. Unsuitable areas are driven by elevation limits, climatic extremes, or hard land-use exclusions rather than gradual degradation.
The resulting maps align closely with Uganda’s known coffee-producing regions (see the map in the work of Kyalo et al. 2023). This agreement is not a calibration outcome but an emergent property of combining independent, literature-based constraints.
These maps do not predict yields. They define where coffee cultivation is ecologically and legally plausible. As such, they function as a spatial filter: reducing uncertainty, constraining downstream analysis, and establishing a defensible baseline for field operations, monitoring, and modeling.
How does it compares with real data ?
The suitability maps were evaluated against real-world data: approximately 39,000 coffee farm polygons collected from multiple traders across Uganda. For each polygon, suitability was extracted from the Arabica map, the Robusta map, and a combined map defined as the maximum suitability between the two species.
| Optimal | Sub-optimal | Unsuitable | |
|---|---|---|---|
| Arabica suitability | 36.14 % | 10 % | 53.86 % |
| Robusta suitability | 21.4 % | 47.1% | 31.5 % |
| Combined suitability (either Arabica or Robusta) | 56.95 % | 42.78 % | 0.27% |
The comparison reveals clear structure. When evaluated against the Arabica suitability map, more than half of the observed farms fall into areas classified as unsuitable. This is not a failure of the model but a reflection of reality: Arabica occupies a narrower ecological niche and is not the dominant variety nationwide.
For Robusta, a majority of farms fall within optimal or sub-optimal Robusta zones, consistent with Uganda’s production profile. Sub-optimal classifications dominate, highlighting that much of production occurs in marginal but viable conditions rather than textbook optima.
The absence of variety-level information at farm scale limits interpretation. Some farms classified as unsuitable for Arabica may in fact grow Robusta, and vice versa. The combined metric compensates for this limitation and is therefore the most relevant comparison. Over 99.7% of observed coffee plots fall within areas classified as suitable for at least one of the two species. This indicates that the rule-based approach effectively captures the broad ecological envelope of coffee cultivation without being explicitly calibrated on farm locations.
Only a negligible fraction of farms fall into areas classified as unsuitable for both species. Manual verification shows these cases correspond primarily to geometrical overlaps with protected natural areas rather than true ecological mismatches.
This validation step confirms the role of the maps as a spatial filter. They are not yield predictors and do not aim for pixel-level accuracy. Their strength lies in excluding implausible regions while retaining virtually all observed production, which is exactly the behavior required for downstream monitoring, targeting, and modeling workflows.
Limitations and Next Steps
The model assumes equal importance across all factors and ignores interactions between variables. This simplification is deliberate but restrictive. Elevation, temperature, and rainfall are not independent, and soil constraints often modulate climatic effects rather than acting in isolation. Introducing weighted scoring and validating suitability classes against observed yields would improve the mapping.
Beyond incremental refinements, the search space can be constrained further. Satellite-derived signals or representation-learning approaches based on embeddings trained with ground truth data could capture complex environmental patterns (Brown et al., 2025). These methods would not replace agronomic reasoning but tighten it, reducing false positives while preserving coverage.
Conclusion
Suitability mapping turns environmental uncertainty into clear spatial insight. It provides a fast, interpretable baseline grounded in agronomy, showing where coffee can realistically grow. The resulting maps can help focus field surveys, support policy decisions, and constrain AI workflows for coffee detection and monitoring to ecologically credible areas, directing effort where it matters most.
The approach is intentionally simple and therefore imperfect. There is substantial room for refinement, from better factor interactions to satellite-driven representations and yield-aware validation.
The framework is not specific to Uganda or coffee. It is transferable to other countries and other commodities wherever agronomic knowledge and open data are available.
Interested in discovering the suitability for another countries or commodities to improve your decision making ? Don’t hesitate to contact us !
Sources :
- Brown, C. F., Kazmierski, M. R., Pasquarella, V. J., Rucklidge, W. J., Samsikova, M., Zhang, C., … & Kohli, P. (2025). Alphaearth foundations: An embedding field model for accurate and efficient global mapping from sparse label data. arXiv preprint arXiv:2507.22291.
- DaMatta, F. M., Avila, R. T., Cardoso, A. A., Martins, S. C., & Ramalho, J. C. (2018). Physiological and agronomic performance of the coffee crop in the context of climate change and global warming: a review. Journal of agricultural and food chemistry, 66(21), 5264-5274.
- Kath, J., Byrareddy, V. M., Craparo, A., Nguyen‐Huy, T., Mushtaq, S., Cao, L., & Bossolasco, L. (2020). Not so robust: Robusta coffee production is highly sensitive to temperature. Global Change Biology, 26(6), 3677-3688.
- Kyalo, G., Apunyo, P. C., Mwanjalolo, M., Luswata, C. K., Kawooya, R., & Niyibigira, E. I. (2023). Characterisation and Mapping of Soils in Major Coffee Growing Regions of Uganda. Journal o
- Pham, Y., Reardon-Smith, K., Mushtaq, S., & Cockfield, G. (2019). The impact of climate change and variability on coffee production: a systematic review. Climatic Change, 156(4), 609-630.
- Nigussie, W., Al-Najjar, H., Zhang, W., Yirsaw, E., Nega, W., Zhang, Z., & Kalantar, B. (2024). Enhancing coffee agroforestry systems suitability using geospatial analysis and sentinel satellite data in gedeo zone, Ethiopia. Sensors (Basel, Switzerland), 24(19), 6287.
- Salas López, R., Gómez Fernández, D., Silva López, J. O., Rojas Briceño, N. B., Oliva, M., Terrones Murga, R. E., … & Barrena Gurbillón, M. Á. (2020). Land suitability for coffee (coffea arabica) growing in Amazonas, Peru: Integrated use of AHP, GIS and RS. ISPRS International Journal of Geo-Information, 9(11), 673.
- Uganda Coffee Development Authority (2019). Robusta Coffee Handbook.