Written by Florent Scarpa, PhD. Data Scientist at Sustaain
Last week, one of our clients asked a simple question: “Our dashboards shows n farmers selling to us, but our analyst computed a figure that is almost half of what the dashboard says. Could you help us understand the discrepancy?” Behind this simple question hides the complexity of the data supply chain.
Sustainability data is a soft commodity. Produced by people in the field. Stored, transported, transformed by intermediates across the world. Consumed by end customers in a very different place and a very different form than where it was first extracted. Like any other commodity, sustainability data flows through its own supply chains.
Operators, traders, NGOs and institutions collect data from many different places: field surveys, invoices, transport & storage documents, satellite imagery to cite a few of them. This diversity of data sources is compounded by the diversity of geographies involved in the trade, as each have their own specifics that the data must capture.
The demand for final products is as diverse as the consumer profiles. Every downstream client requires their own indicators. Every domain expert wants to compute metrics their way. Different institutions enforce different reporting standards, and so do public benchmarks.

The picture of this multidimensional space of possibilities still lacks one dimension: time. Every year, your final data clients will ask for new recipes and brand new products.
These considerations are business as usual in the world of commodity operators. But if your organization lacks the capability to handle the supply & demand of data the same way it does for physical commodities, then you have a problem.
Why Sustainability KPI Definitions Break Down Across Supply Chains
What we call the reporting problem is the ever-increasing difficulty to answer all the reporting needs that stem from the different information consumers, using the data at your disposal. Let’s reconsider our client’s simple question: How many farmers do I work with?
The KPI Definition Challenge: Why “Number of Farmers” Has No Single Answer
First let’s agree to disagree on what is the right formula to compute that number.
Ask the people in your global sustainability team. They might tell you that you should only count active farmers. What is an active farmer? One that still owns a working farm? One that sold volumes to your company within the last year? One that your field team visited recently enough? What if they left the business, or sell to other companies but might still come back in your network at some point?
The diversity and ambiguity of semantics that hides behind such a word is already overwhelming and source of endless (sometimes heated) debates between sustainability experts. Already the apparent simplicity of theory VS. the reality of the world transforms our simple question into a real brain teaser. A global sustainability expert might tell you they want to know about every farmer that ever supplied the company, directly or indirectly. A local farmer support officer might tell you they only care about farmers that they are actively supporting.
Add to this the inherent differences between production systems across geographies and commodities. In some countries farmers are mostly smallholders working their farm alone. In others they work a lot with family (children, cousins), community members or immigrant workers. Other systems work with large farms that employ many people. Who do you include in the count?
As an example, two different clients can view the question in drastically different ways. One sees it as a single number that merges all suppliers together, while the other sees four different ones for farmers only:
| Operator 1 | Operator 2 |
|---|---|
| Number of suppliers | Number of farmers found in the company registry |
| Number of farmers registered in the company’s sustainable programs | |
| Number of farmers supplying volumes to the company | |
| Number of farmers in groups from which commodity is directly sourced |
Downstream stakeholders may ask further refinements: count by gender, age group, farm size, registered in their own programs. Moreover, these requirements can and will change every now and then to adapt to everyone’s view on what’s the best way to count.
What may happen is that different people, even in the same team, will work with their own version of the number to accommodate their own needs.
Data Quality as a Structural Barrier to Reliable Sustainability Reporting
The analyst in charge of counting the farmers from the raw databases actually has to solve two problems:
- KPI Definition: decide how exactly farmers should be counted
- Data quality and availability: make sure that the required registries exist, are complete, correct, up to date and match the exact definition of farmers that you want to use
More often than not, things work the other way around. Analysts assess the available data and the context in which they were collected. From this they either submit a definition of farmer count that is accepted by the reporting teams. Or they plan with field teams to collect data differently in the future to solve the lack of exploitable data. Therefore data quality naturally influences KPI definition.
Here are some issues that fuel the data quality problem:

The Cost of Unmanaged Reporting: Inefficiency, Distrust and Repeated Errors
Here is a typical chain of events we can observe when KPI definitions and data quality are left unchecked

When it is not tackled early on, the reporting problem starts manifesting its symptoms:
- Stakeholders are unhappy about inconsistent KPI values
- Sustainability distrusts analytics, everyone starts making their own computations
- Analytics spend their entire time trying to fix quality issues instead of delivering powerful insights
- Origins (and the people they survey) grow frustrated with repeated information requests
Multiply this by numerous origins, clients and KPIs and your reporting problem might turn into reporting hell.
How to Fix the Sustainability Reporting Problem: Standards and Semantic Layer
When you try to model the real world, there is no one size fits all. Completely solving the reporting problem may be impossible, but in can be kept under control by improving systems and methods. Definition standards provide independent, science-based frameworks that everyone can follow to avoid re-inventing the wheel and enable benchmarking. On the other end, robust, well-documented data models allow business users to build their own metrics on the go.
Industry Standards for Harmonization: From GHG Protocols to the ICI Child Labour Model
Established standards solve the KPI definition conundrum by putting everyone on the same page. They allow benchmarks to make sense by making sure we compare apples with apples between companies. They provide independent guidelines that avoids malicious manipulation of information by one actor. However, reaching a universally adopted standard remains difficult.
Carbon emissions accounting has seen the emergence of many reporting standards in the past decades: GHG Protocol, GRI, Bilan Carbone, ISO 14064… Now a few of them are commonly used across sectors.
On the other hand, reporting standards are less mature on other ESG issues that are less global regarding their impact on consumer countries. Take child labour as an example. While it has been heavily covered by media, the reporting standards are not as developed and widely adopted as the carbon accounting ones.
In the West Africa cocoa sector, the International Cocoa Initiative (ICI) managed to bring together all the main cocoa/chocolate companies, governments, international and farmer organizations. They build their own standard for Child Labour Monitoring and Remediation Systems (CLMRS) that adapts United Nations guidelines to the reality of the region’s cocoa production. This is a great example where all actors work together to build a standard that fits both ideals and field reality.
Beyond Standards: How a Semantic Layer Enables Flexible KPI Generation
Not everything can be cast in stone. Company internal operations involve a diversity of roles with different information needs. Client reporting may follow standardization efforts, but their own internal operations will always bring reporting requirements that may be non-negotiable. Moreover, even the most global standards change with time to incorporate new findings and provide better results.
And that’s perfectly alright. Standardization is a clear axis of improvement. But so is versatility. However, if you don’t follow clean data architecture principles, you will build a new pipeline for every new variant of your KPI. And soon enough your database will look like this:
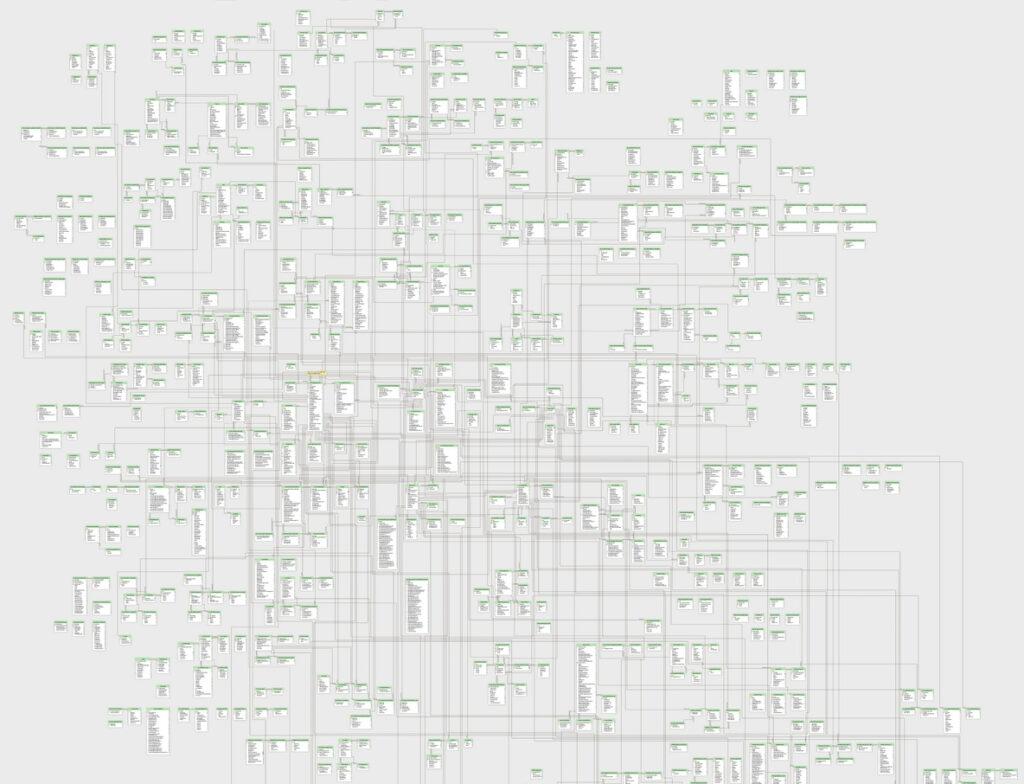
The key to unlocking versatile KPI generation that makes sense for business users without requiring an army of data laborers constantly at work is the semantic layer.
The semantic layer is the layer of your data systems that turns massive raw data into actionable insights. Proper design principles make the semantic layer capable of answering new reporting needs with ease:
- An independent data model. Pipelines should adapt to the data model, and not the other way around. If your analytics team builds new tables every time you need a new KPI, you’re doing it wrong. That is how you end up with an exponential growth of your database structure with tables whose purpose was long forgotten.
- A data model that fits the real world. Tables should make sense to non-tech users. In our farmer count example, we should have one table that lists farmers, with a set of tables that list properties: business activity status, sustainability programs, socioeconomic status, etc. This way sustainability teams can use BI tools to count farmers exactly the way they need with no ambiguity.
- Rich metadata that fill in missing context information: date and process of data collection/transformation, lineage, change history, ownership, etc. Such metadata keeps track of the who, when, how and why of the data you’re looking at.
- A data catalog that documents and allow business users to discover the data. The data catalog lists the available data, along with their description and metadata. Users can explore it and understand what KPIs they can build from the data at their disposal without the assistance of data teams. BI tools and AI agents can leverage the data catalog to make a reality of the seamless KPI self-service experience.
How Sustaain Solves Sustainability Reporting for Commodity Operators
Solving the sustainability reporting problem requires both a great expertise in building data systems and a strong understanding of the soft commodity market dynamics, operations, challenges.
We carefully develop this double expertise that allows us to model soft commodity supply chains and the sustainability processes that revolve around it. We work closely with operators, institutions and organizations in a co-design fashion. We build data pipelines that ingest messy real-world data, clean it and transform it into insights that drive decision making.
The tangible outcome of this methodology are a set of core KPIs that cover most sustainability topics. Their definition stems from our experience working with multiple actors of the field. In addition to that, we are building the semantic layer that will allow sustainability teams to take data into their own hands.
As data experts, quality monitoring and remediation capability is built in our data platform, because data should serve sustainability teams, not the other way around.
If you struggle kickstarting or scaling your sustainability data and reporting, contact us and we’ll be happy to help you out.
